Platform
The whole plant, at a glance
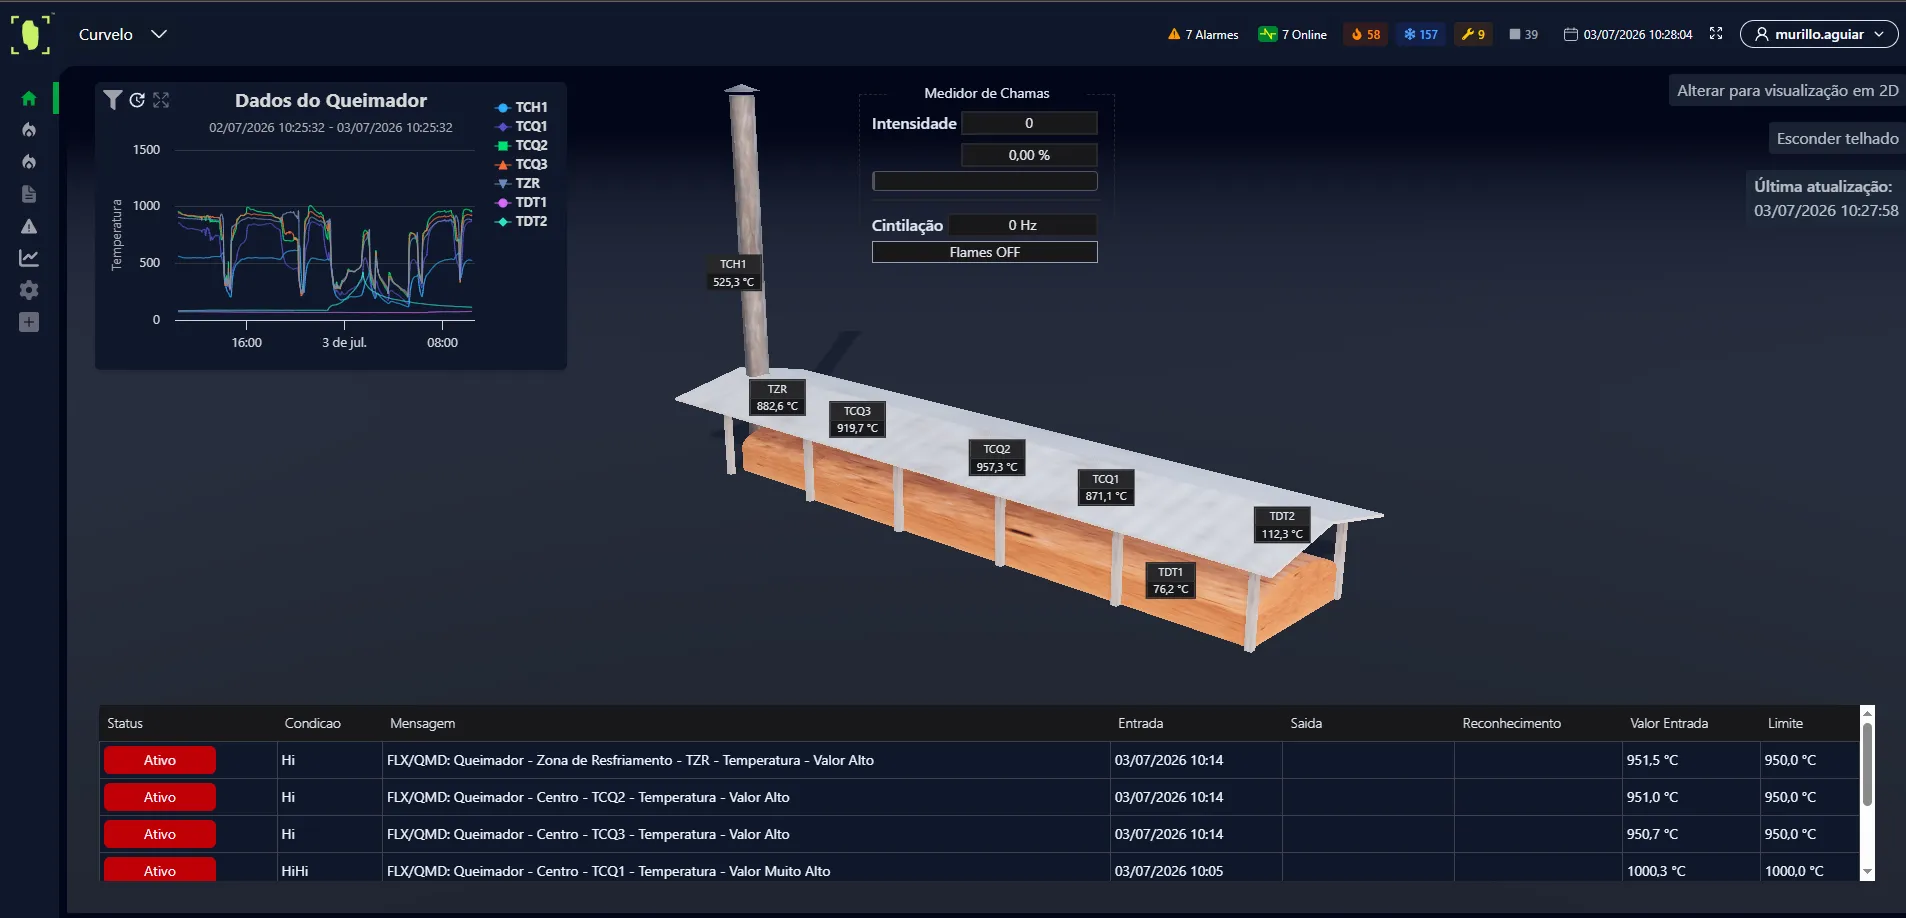
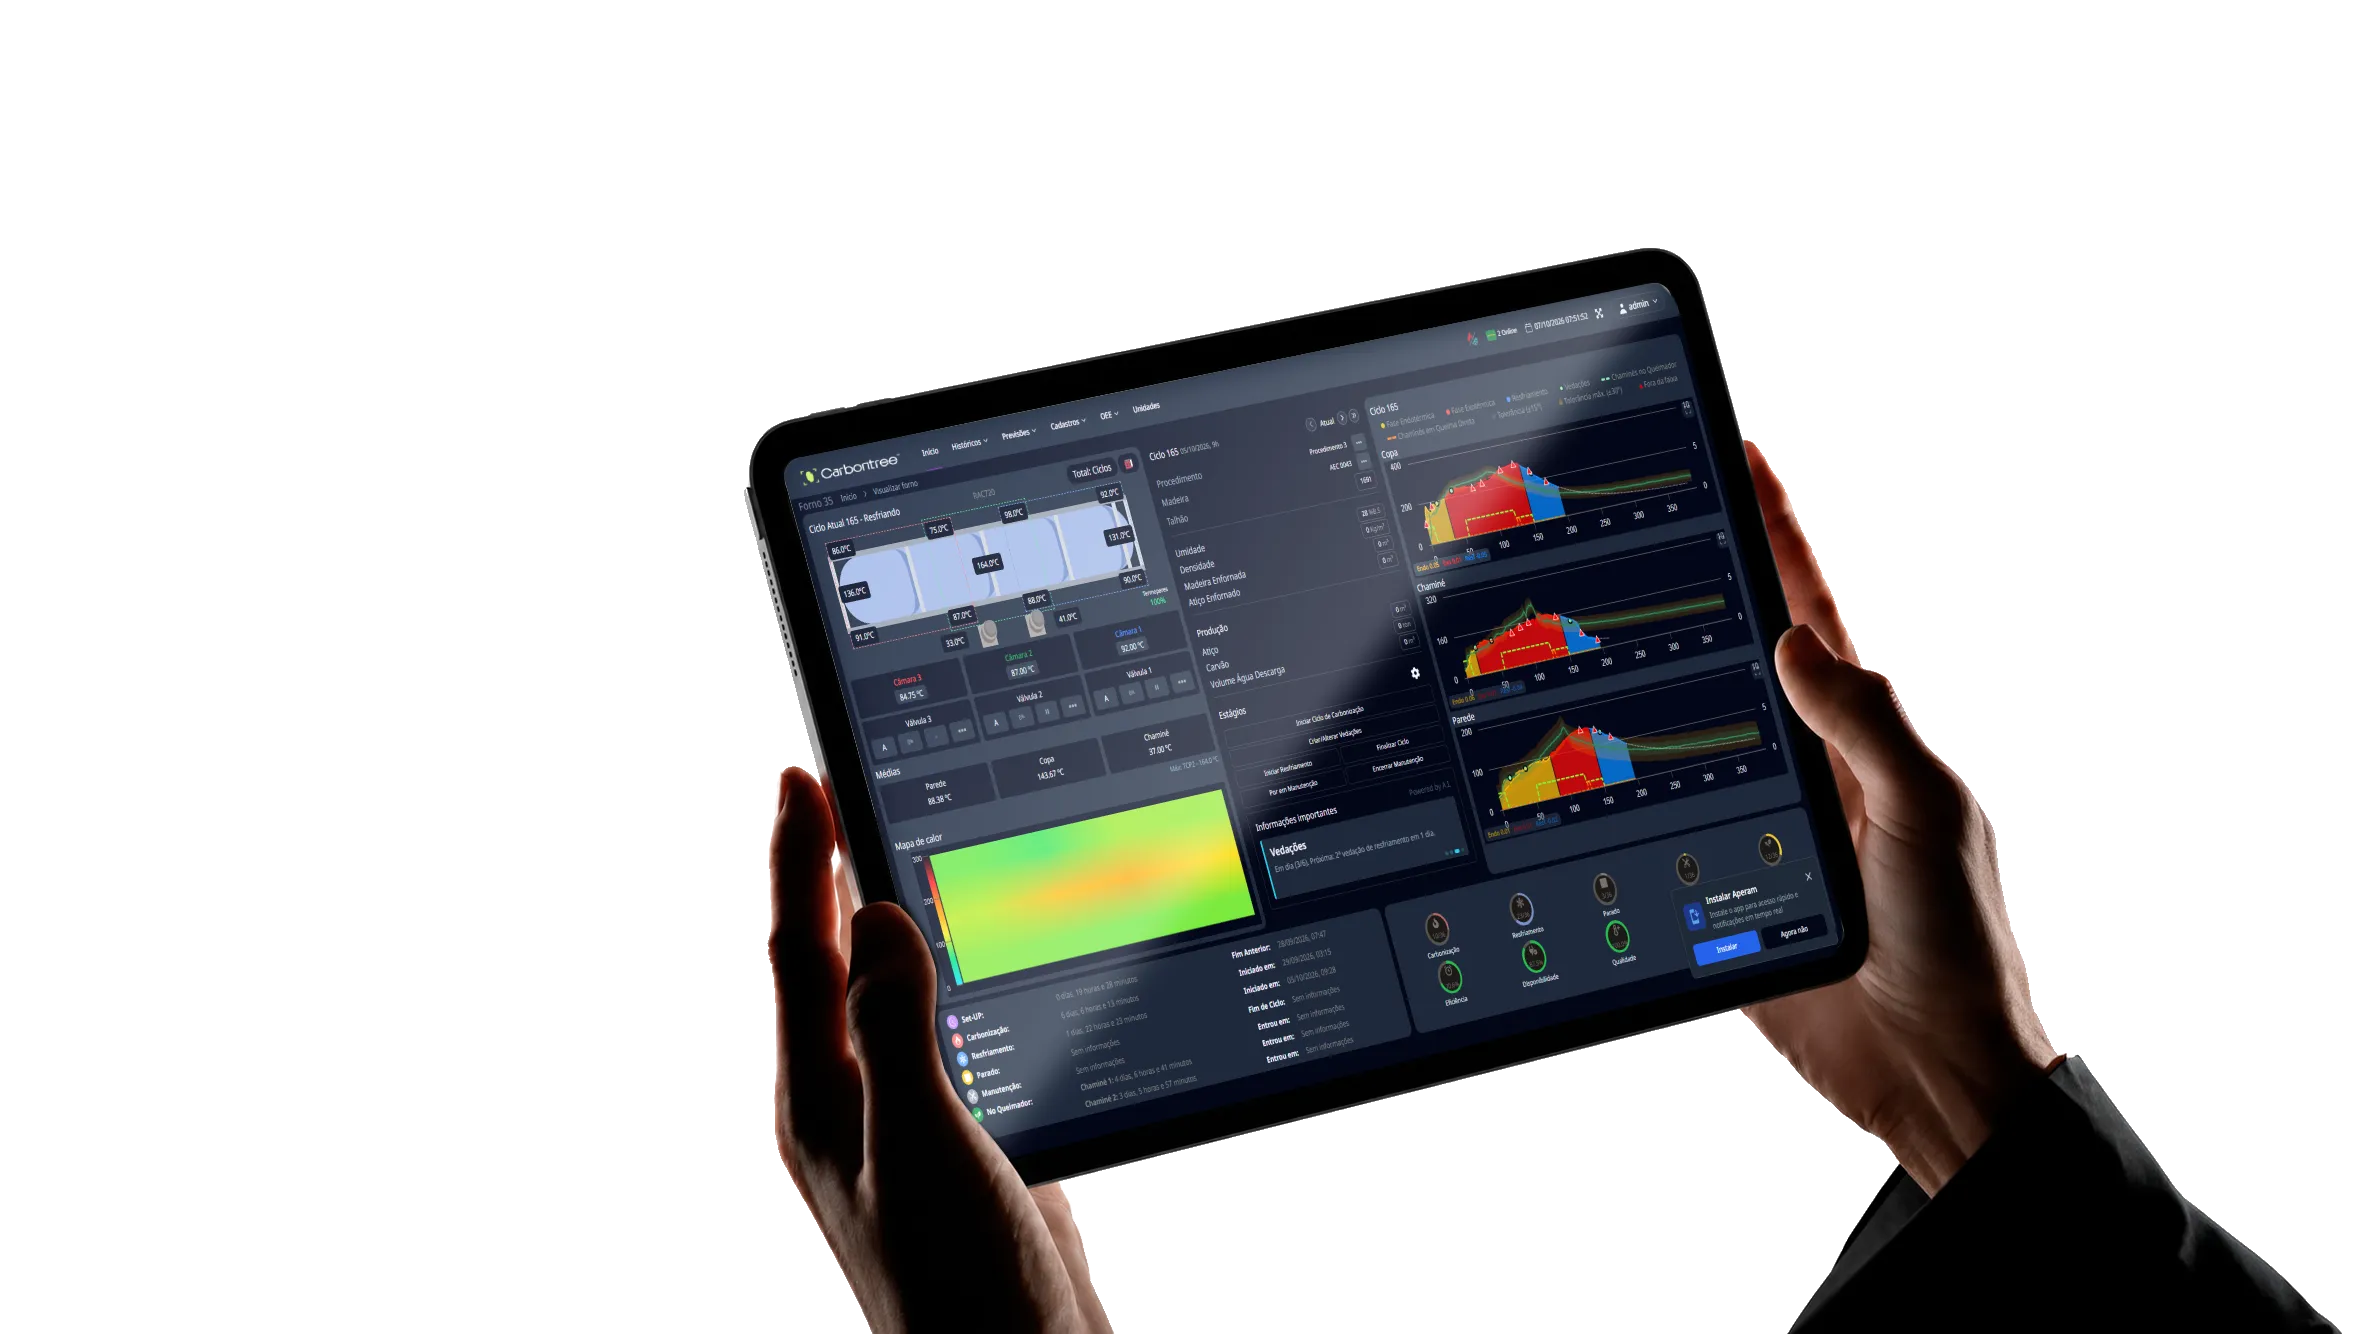
Temperatures, curves and process stages tracked in real time, with the condition of every kiln brought together on a single web dashboard.
- Real time
- Web dashboards
- Multi-unit
Web monitoring of kilns, temperatures, curves, burners and cooling cycles for a more standardized, traceable and efficient production.
98%
Sensor accuracy
24/7
Continuous monitoring
±2°C
Temperature margin
12+
Units in operation
In many plants, process data stays scattered, readings are reviewed late, and each team runs carbonization differently. Carbontree turns every cycle into traceable operational information.
Temperatures, curves and process stages tracked in real time, with the condition of every kiln brought together on a single web dashboard.
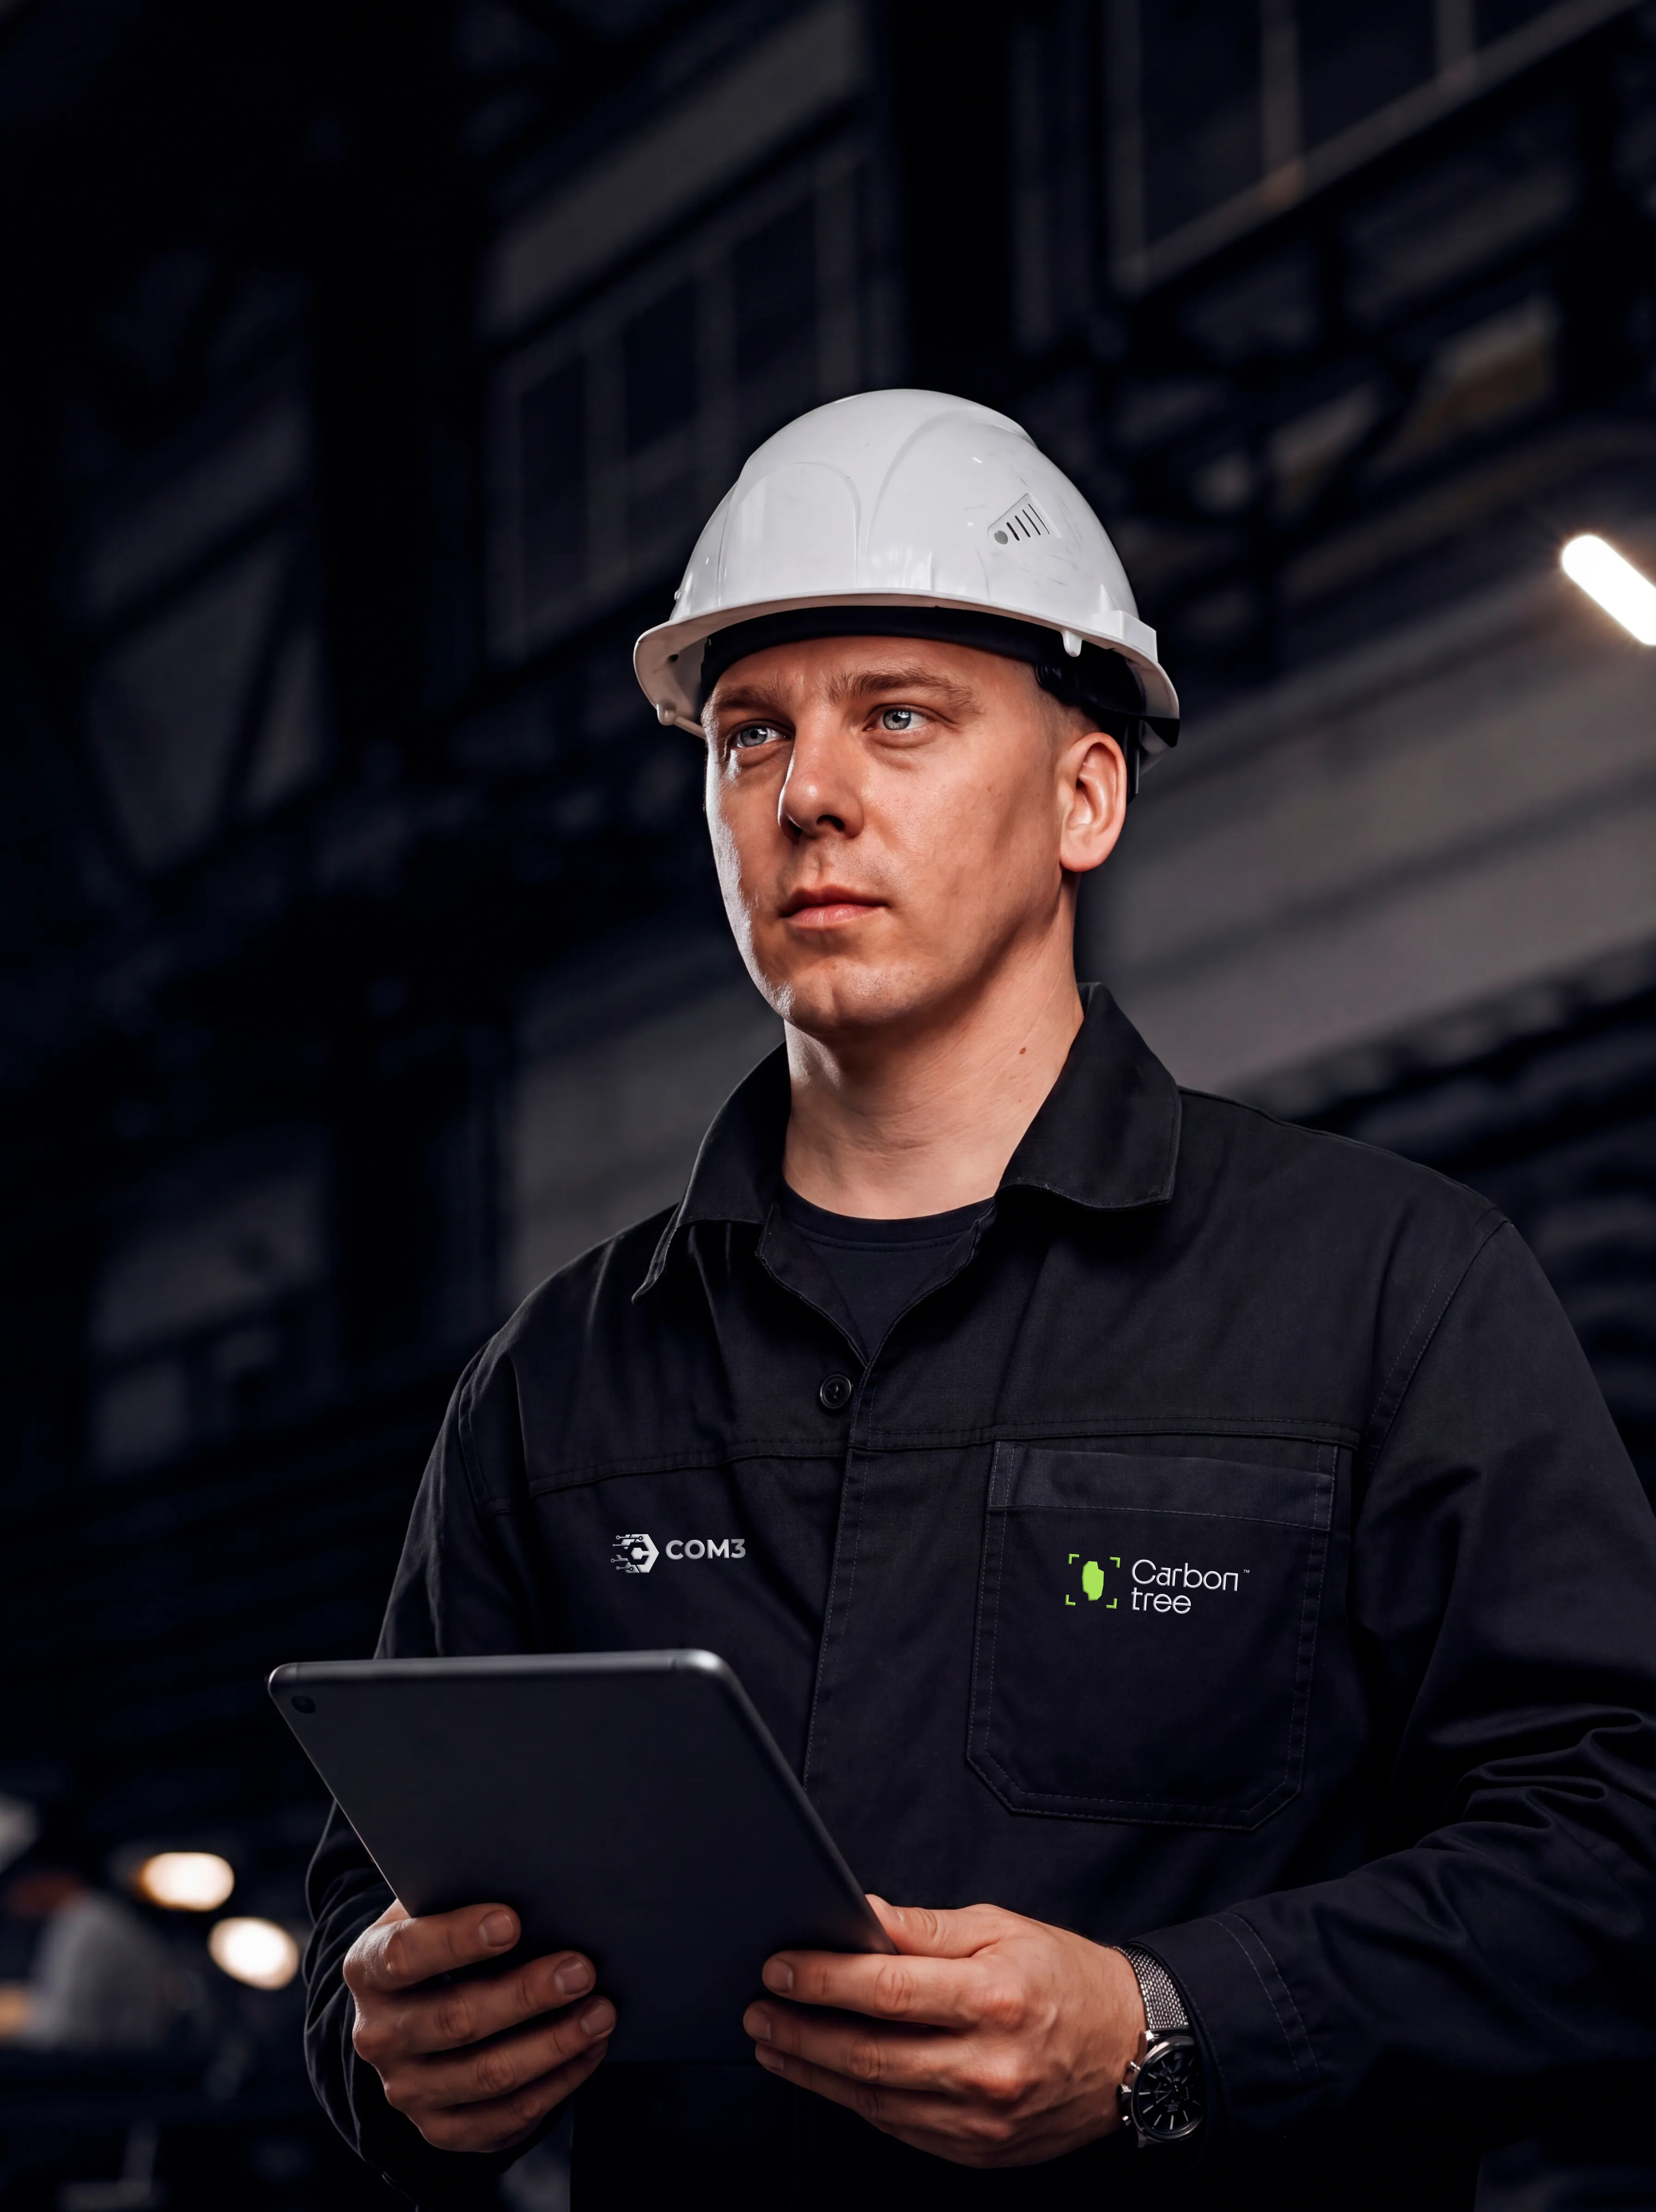
Sensors, PLCs, IoT, SCADA and databases integrated according to the project.
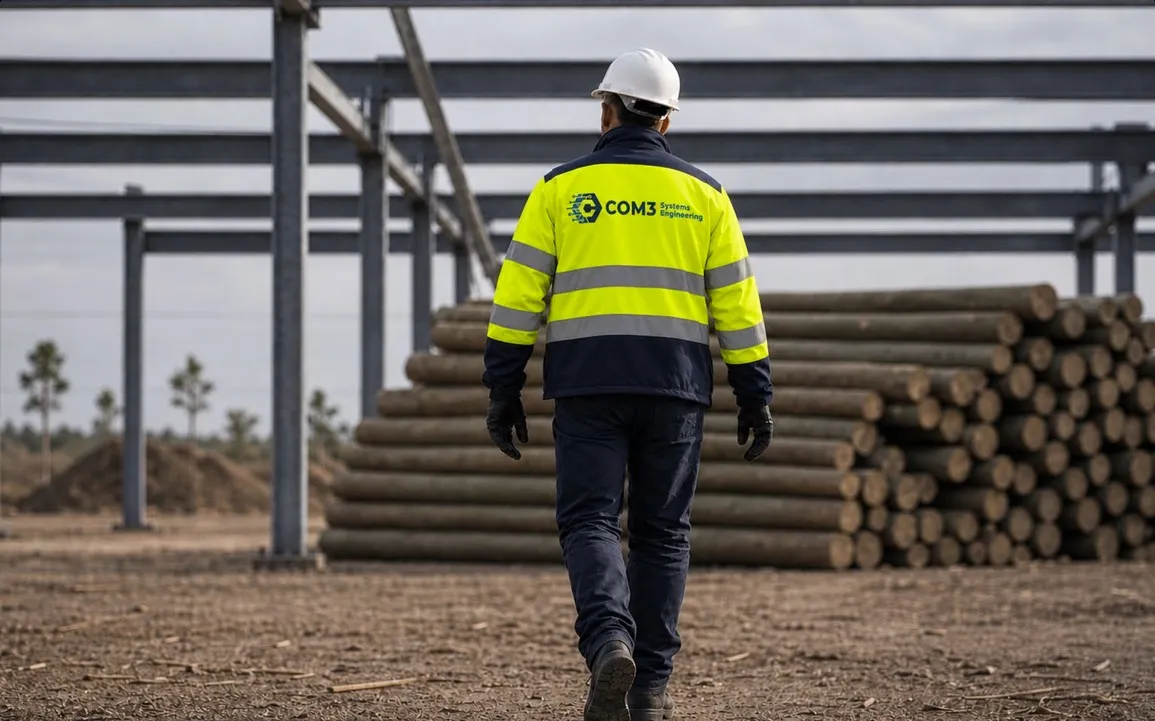
Integrated forestry operations and distant units tracked from wherever you need, without a round trip to every kiln just to see what's happening.

Traceability by kiln, cycle, batch, period and production unit, with comparisons across carbonizations throughout the operation.
Process monitoring, history management and performance indicators on the same web platform.
Every carbonization cycle is logged, comparable and available for technical analysis and production management.
Temperatures and carbonization curves tracked as the cycle happens, with visualization of process stages and each kiln's condition.
Tracking of burners and cooling cycles from start to finish of every carbonization, from loading to unloading.
Alarms for temperature, time and operating condition deviations, flagged while the cycle can still be corrected.
Traceability by kiln, cycle, batch, period and production unit, with histories, trends and comparisons across carbonizations.
Duration, stability, productivity and performance indicators, with operational reports for technical analysis and production management.
Integration with sensors, PLCs, IoT, SCADA and databases, according to the architecture defined for each plant.
Information from different kilns and units brought together in one place, so production, maintenance and management can act in a coordinated way.
Temperatures, curves and stages of every kiln tracked as the cycle happens.
Web dashboards for local or remote supervision, with kilns and units consolidated in one place.
Every carbonization logged by kiln, cycle, batch, period and production unit.
Deviations flagged before they compromise the whole cycle.
Temperature, time and operating condition deviations flagged while there's still time to correct them.
Everything you need to know before bringing carbonization monitoring to your plant.
It's a web operational-intelligence platform for carbonization plants. Kilns, temperatures, curves, burners and cooling cycles are monitored in one place, turning every carbonization cycle into traceable operational information.
In many plants, process data stays scattered, readings are reviewed late, and each team runs carbonization differently. Without a consolidated history:
Process monitoring follows the whole cycle:
Every carbonization is logged, comparable and available for analysis:
Yes. Integration is defined per each plant's project and covers:
In operations that need to standardize cycles, track kilns and consolidate production data:
Because the gain shows up in process control and production standardization:
Access and history are controlled by unit and by responsibility:
Deployment can be local, remote or hybrid, depending on the architecture approved for each plant. Since the dashboards are web-based, units can be supervised from inside or outside the operation.